Staying invested while the market is falling
March 24, 2020 | Authored by Ryan C. Smith CFP®
March 24, 2020 – When investors ask Dopkins Wealth Management* Advisors the question, “Why should I stay invested while the market is falling?” they are really trying to gauge whether or not it is the right time to be in the market. The concept of “timing the market” is the root of this question and all questions regarding staying invested or moving to cash along with everything in between. To successfully “time the market” an investor must be correct twice; when to get out and when to get back in. So, the market timer needs to predict the peak of the market and then the pit of the market in order to be successful. Making one of these predictions is hard, making the second is really difficult.
For a printable copy of this article, please click here.
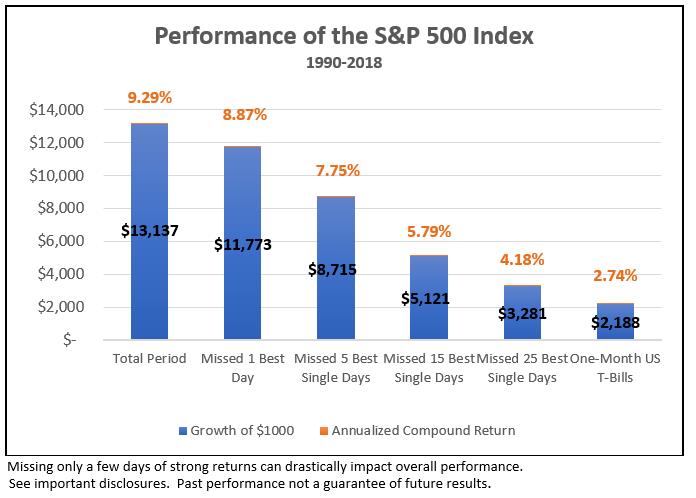
The stock market can deliver highs and lows in a very short period of time. Just like the market has gone down over the past month with tremendous volatility, the market can go right back in the same amount of time. Missing out on just a few of these big gain days in the market can have a significant impact on an investor’s portfolio long-run returns. Since making these predictions is near impossible over long-term periods, the wise choice is to stay invested during the periods of market volatility.
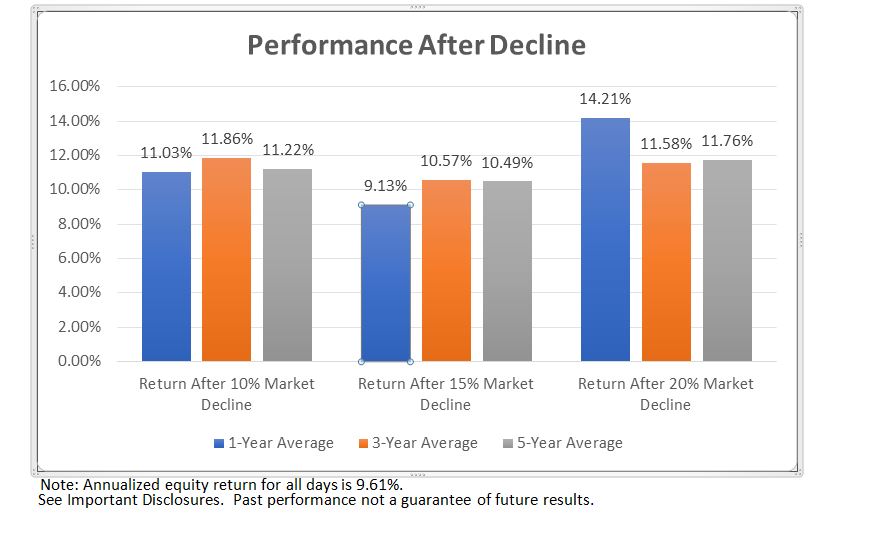
Of course, sharp and swift market downturns can make any investor uneasy. It is important to stick with your plan and the portfolio you built with your advisor. As the graphics depict, US equity returns after steep drops have been positive. Stocks have generally performed well over one-year, three-year, and five-year periods after declines like the one we are experiencing now. To highlight this, just one year after a decline of 10% or 20% returns outperformed the long-term average of 9.6% furthermore, the return after a 15% drop off was within .5% of that average.
To summarize, there is no ‘get rich quick scheme’ in the market, growing wealth has no shortcuts. A strong investment approach, a long-term strategy, along with the discipline to follow this plan will most likely lead you to a fruitful financial life.
Staying the course can realize returns:
Reacting Can Hurt Performance:
For more information, please contact Ryan Smith, Investment Advisor, Dopkins Wealth Management, LLC*, at rsmith@dopkins.com.
* Dopkins Wealth Management, LLC is a registered investment advisor owned by the partners of Dopkins & Company, LLP
Disclosure:
Indices are not available for direct investment. Their performance does not reflect the expenses associated with the management of an actual portfolio. Past performance is not a guarantee of future results. For illustrative purposes. The missed best day(s) examples assume that the hypothetical portfolio fully divested its holdings at the end of the day before the missed best day(s), held cash for the missed best day(s), and reinvested the entire portfolio in the S&P 500 at the end of the missed best day(s). Annualized returns for the missed best day(s) were calculated by substituting actual returns for the missed best day(s) with zero. S&P data © 2020 S&P Dow Jones Indices LLC, a division of S&P Global. All rights reserved. “One-Month US T-Bills’ is the IA SBBI US 30 Day TBill TR USD, provided by Ibbotson Associates via Morningstar Direct Data is calculated off rounded daily index values.
Past performance is no guarantee of future results. Periods in which cumulative return from peak is -10%, -15%, or -20% or lower and where a recovery of 10%, 15%, or 20% from trough has not yet occurred are considered downturns. For the 10% threshold, there are 3,442 observations for 1-year look-ahead, 3,396 observations for 3-year look-ahead, and 3,345 observations for 5-year look-ahead. For the 15% threshold, there are 3,175 observations for 1-year look-ahead, 3,167 observations for 3-year look-ahead, and 3,166 observations for 5-year look-ahead. For the 20% threshold, there are 2,561 observations for 1-year look-ahead, 2,560 observations for 3-year look-ahead, and 2,560 observations for 5-year look-ahead. 1-year, 3-year, and 5-year periods are overlapping periods. The bar chart shows the average returns for the 1-, 3-, and 5-year period following market declines. Data provided by Fama/French, available at mba.tuck.dartmouth. edu/pages/faculty/ken.french/data_library.html. Eugene Fama and Ken French are members of the Board of Directors of the general partner of, and provide consulting services to, Dimensional Fund Advisors LP. Short-term performance results should be considered in connection with longer-term performance results. Indices are not available for direct investment. Their performance does not reflect the expenses associated with the management of an actual portfolio. Investing risks include loss of principal and fluctuating value.
There is no guarantee an investment strategy will be successful Dopkins Wealth Management, LLC is an investment advisor registered with the Securities and Exchange Commission.

About the Author
Ryan C. Smith CFP®
Ryan provides financial solutions to individuals, trusts and businesses. His services include guidance to clients regarding financial planning, investments and portfolio analysis.